Solution Advantages

Solution Advantages

Are you struggling with System Reports?

❌ Cluttered format, not friendly for executives.

❌ Time consuming to run, combine, and cleanse.

❌ Static and difficult to interact with and collaborate.

❌ No drill through to check the details behind a number.

❌ Limited information that’s missing the big picture.

Check out our Firm Overview Dashboard!

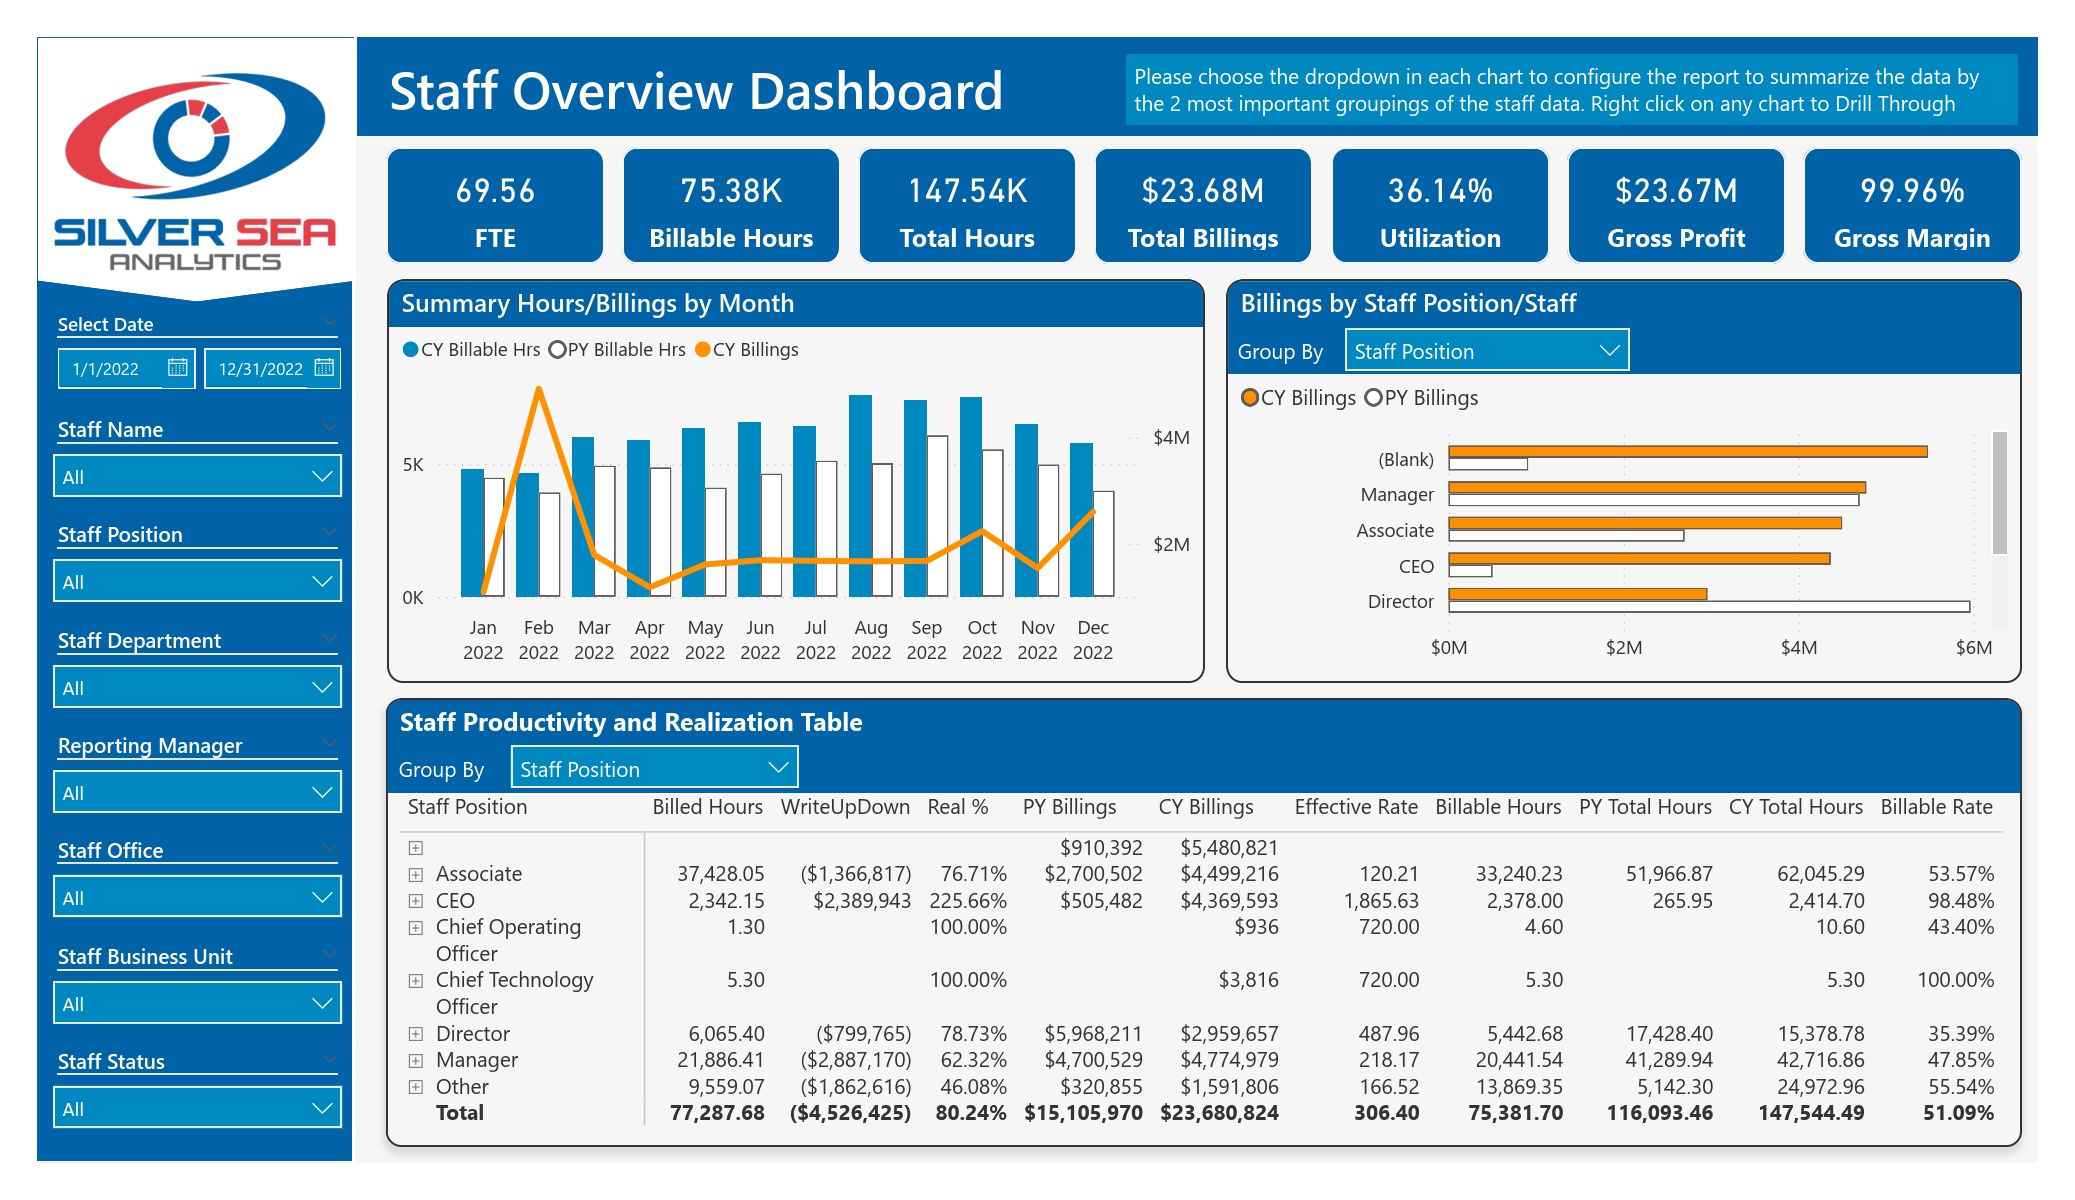
Our Firm Overview Dashboard is packed with features. It allows you to analyze all common KPIs for a firm in one place. You can easily slice and dice your data by date range, business unit, departments, partners, etc…

    • Analyze all common KPIs for a firm in one place.
    • Slice and dice your data by date range, business unit, departments, partners, etc…
    • Monitor annual or monthly trends.
    • Drill through to check the calculations and investigate any anomaly, chasing down to the detailed transactions.
    • Collaborate with other team members in real time
    • Monitor annual or monthly trends.
    • Drill through to check the calculations and investigate any anomaly, chasing down to the detailed transactions.
    • Collaborate with other team members in real time.


Immense value right out of the box! 

We have prebuilt templates that we can implement for your firm within just a few days, saving you time, productivity and cashflow

    • Firm KPI overview
    • Client Profitability
    • Staff Productivity
    • Unbilled WIP Aging
    • Aged Accounts Receivable Aging
    • Workstream Project budget vs. actual
    • Workstream Project workload analysis
    • Staff Productivity Goal summaries

And so much more

Introducing Modern BI Solutions

A DEEPER LOOK INTO YOUR DATA WITH

  • Our Client Analysis report provides a snapshot of current client KPI activities, client billing status, current revenue, and further details per client seamlessly. 
  • Our Power BI Staff Analysis report shares a summary of staffing KPIs and drills down into individual staff performance, with alerts set for overtime hours. 
  • Our Open Account Receivable Summary report shows all billing activities, outstanding days, and AR balances by office and individual client. 
  • Additional reports include RevenueUnbilled WIP by Client, or Unbilled WIP by Engagement, with direct access to view further details. 
 Our Firm Overview Dashboard provides valuable data insights you need to make quick, informed decisions for your business and streamline your operations to maximize revenue.
Free consultation

A DEEPER LOOK INTO YOUR Business Intelligence DATA WITH

  • Our Power BI Client Analysis report provides a snapshot of current client KPI activities, client billing status, current revenue, and further details per client. 
  • Our Staff Analysis report shares a summary of staffing KPIs and drills down into individual staff performance, with alerts set for overtime hours. 
  • Our Open Account Receivable Summary report shows all billing activities, outstanding days, and AR balances by office and individual client. 
  • Additional reports include Revenue, Unbilled WIP by Client, or Unbilled WIP by Engagement, with direct access to view further details. 
 Our Firm Overview Dashboard provides valuable data insights you need to make quick, informed decisions for your business and streamline your operations to maximize revenue.
Free consultation

Experience b.i. with our time entry overview demo dashboard

Advanced charting with our Business Intelligence Revenue Analysis Dashboards