
Are you satisfied with the reporting capabilities of mainstream practice management software like CCH Axcess, Practice CS, or Practice Management? While these systems cover the basics, they often fall short in providing advanced features like drill-through capabilities, prioritizing critical data, or interactive tools to analyze anomalies. In today’s data-driven landscape, accounting firms need more than static reports—they need powerful, scalable, and cost-effective analytics solutions.
Compared to platforms like Tableau and Qlik, Power BI delivers unmatched value. Power BI Pro starts at $10 per user per month (soon to be $14 in April 2025. Read more here), while Tableau Creator costs $70 per user per month and Qlik begins at $825 per month. With seamless integration into Office 365, Power BI offers robust functionality at a fraction of the cost, making it a practical choice for firms of all sizes. In fact, in 2024, Power BI was recognized as the leader in analytics by Gartner’s Magic Quadrant for the 16th year in a row (Read more here)
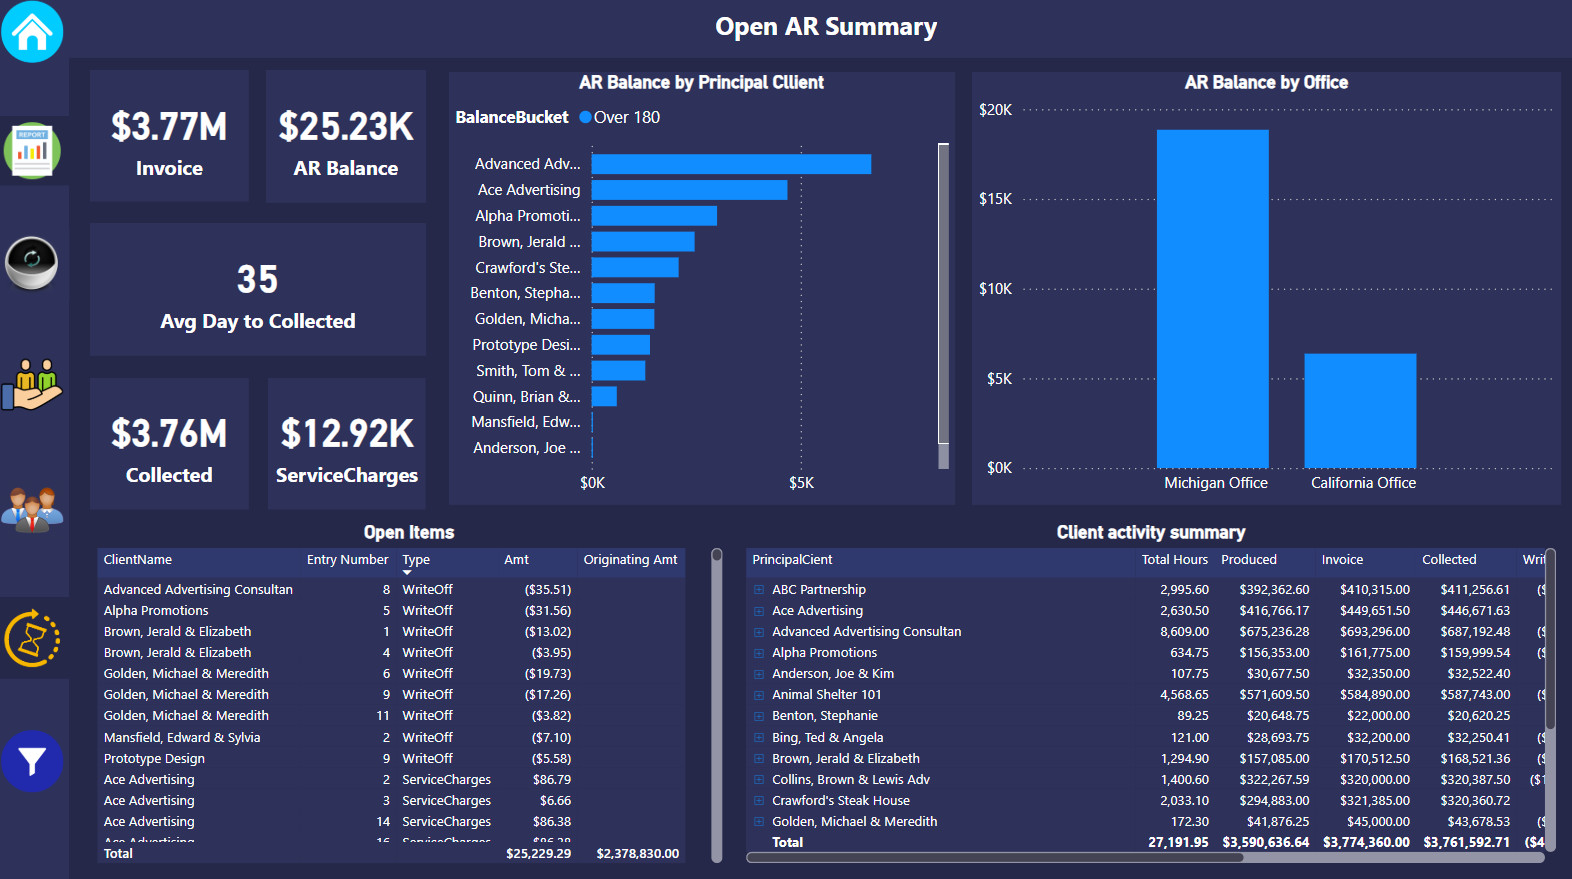
Since adopting Power BI in 2016, I’ve built custom dashboards and reports for over 30 accounting firms across the U.S., particularly for those using CCH Data Axcess Utility and Practice CS. These reports transform raw data into actionable insights, allowing firms to track time entry data, monitor KPIs, and uncover performance trends with ease.
Click here to experience a sample analysis of Practice CS data
Are you ready to modernize your firm’s management with insightful dashboards? Let’s connect and explore how Power BI can work for you!